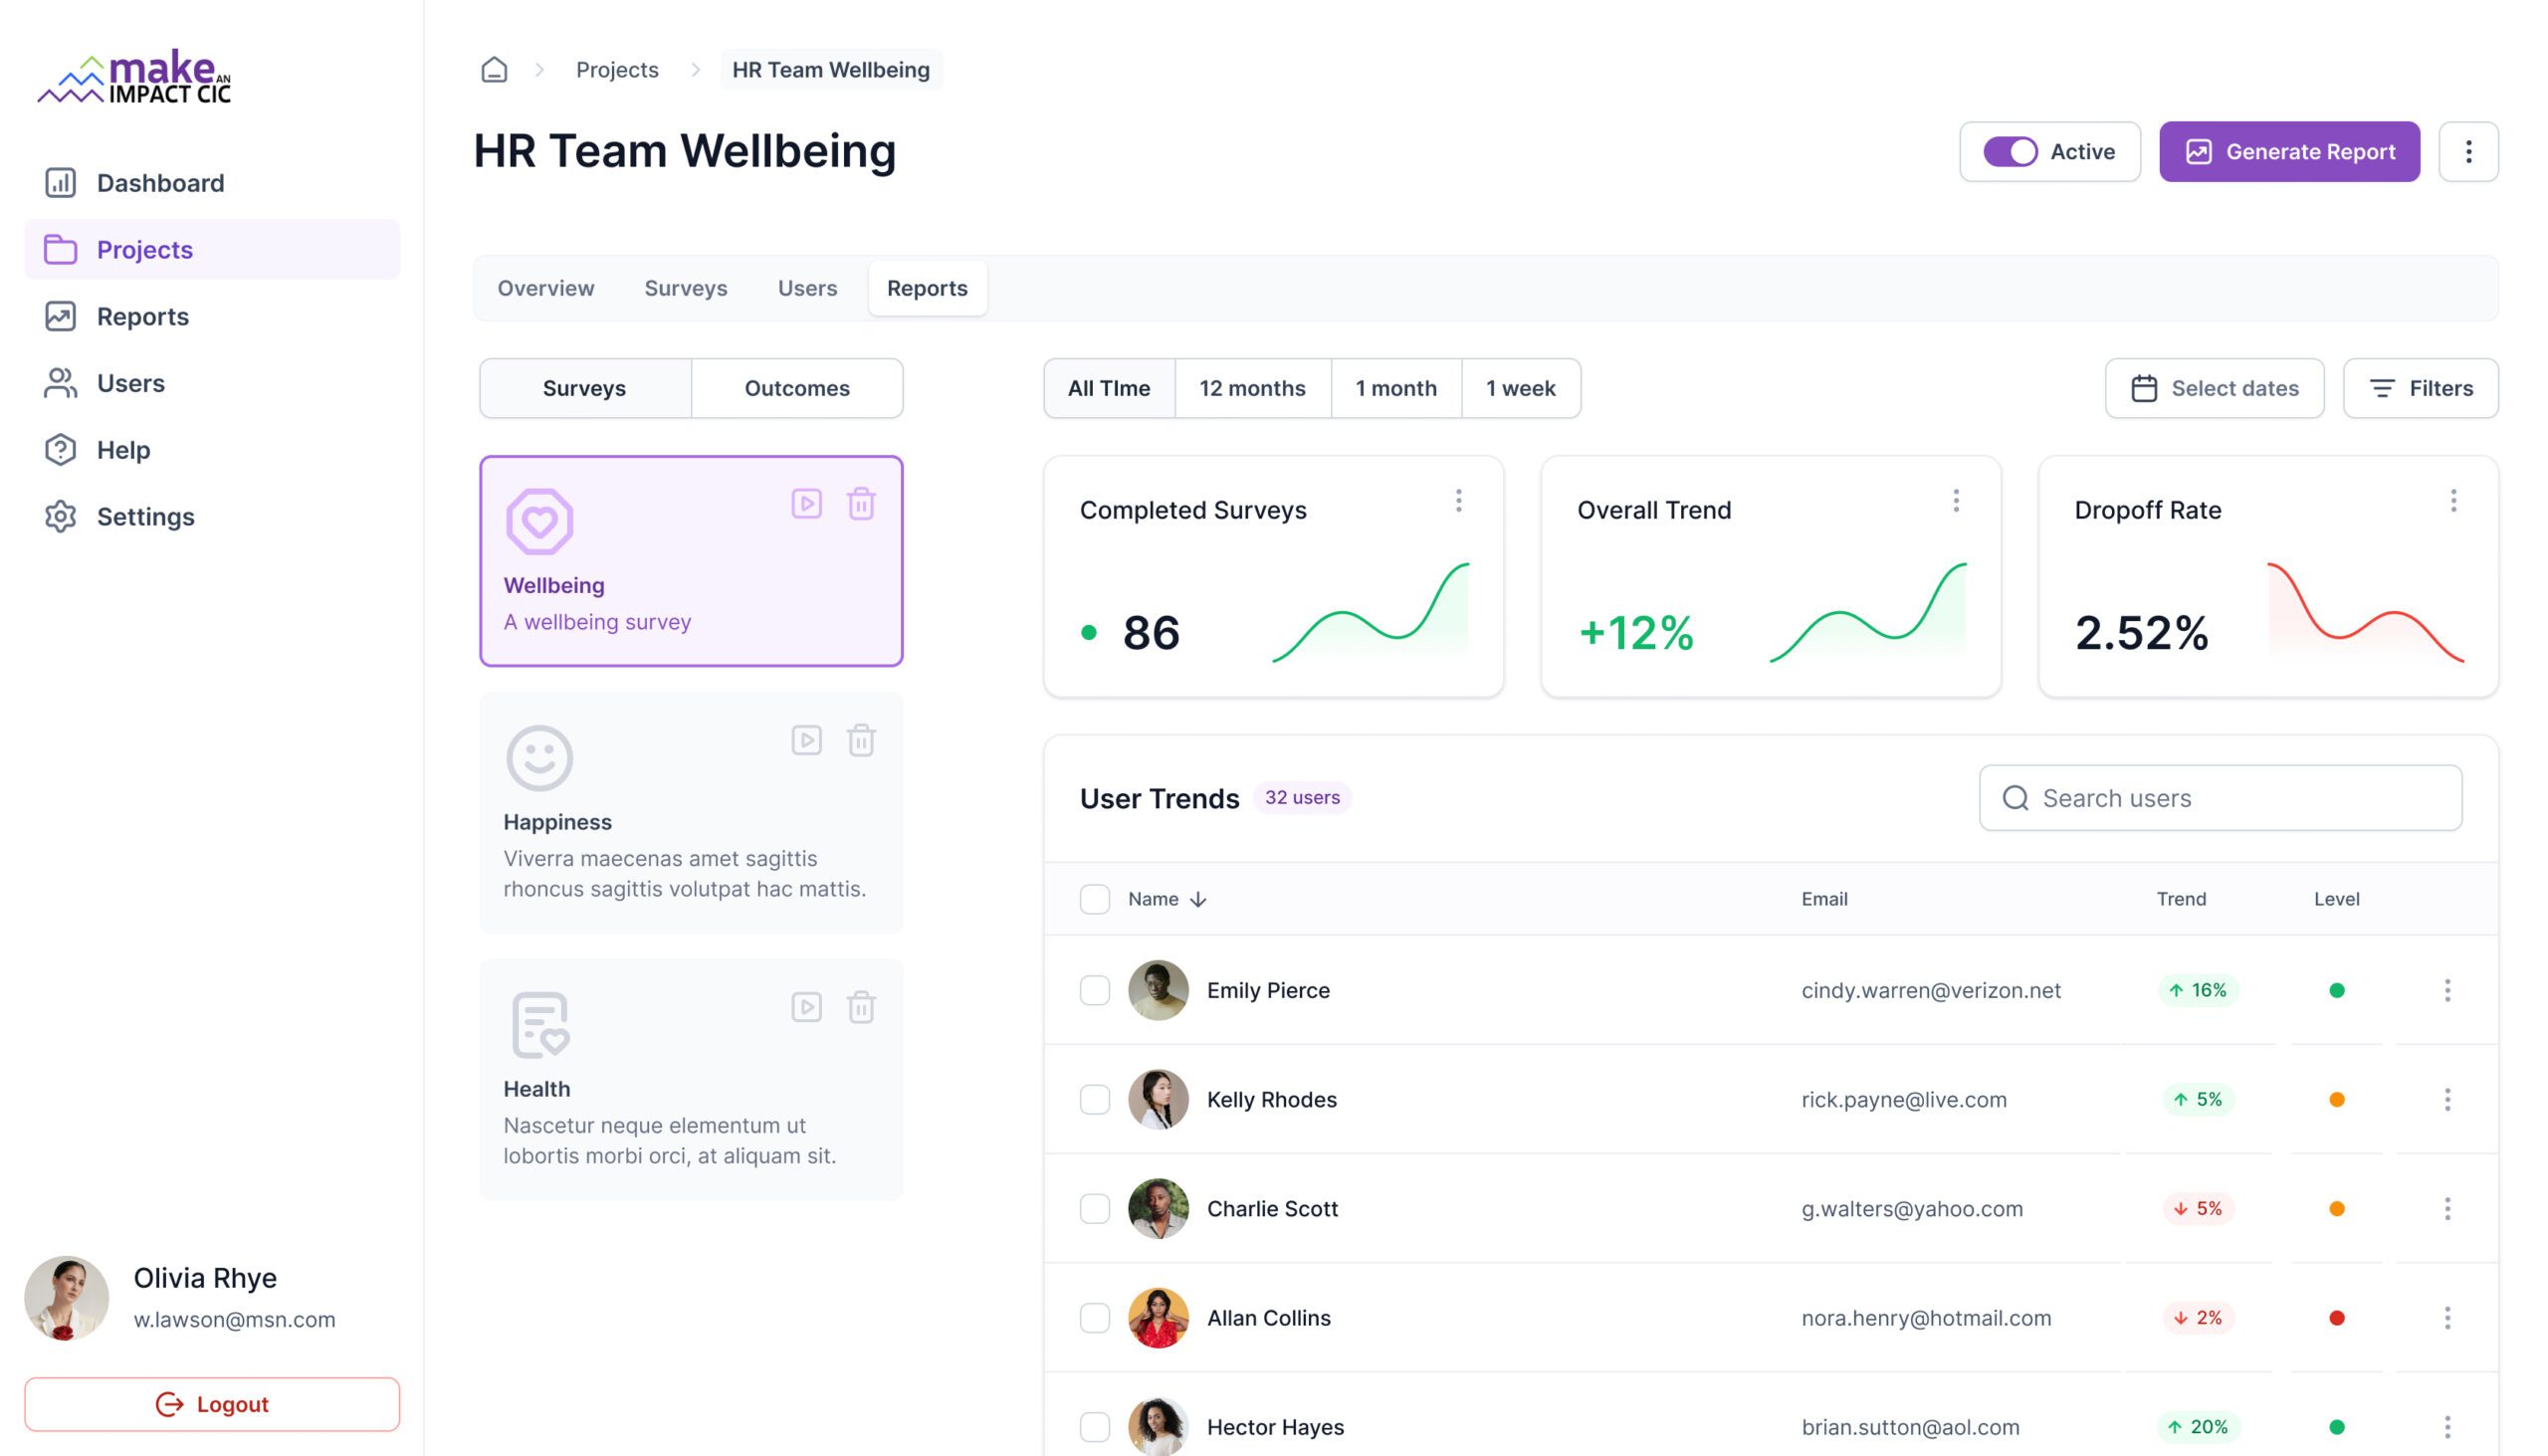
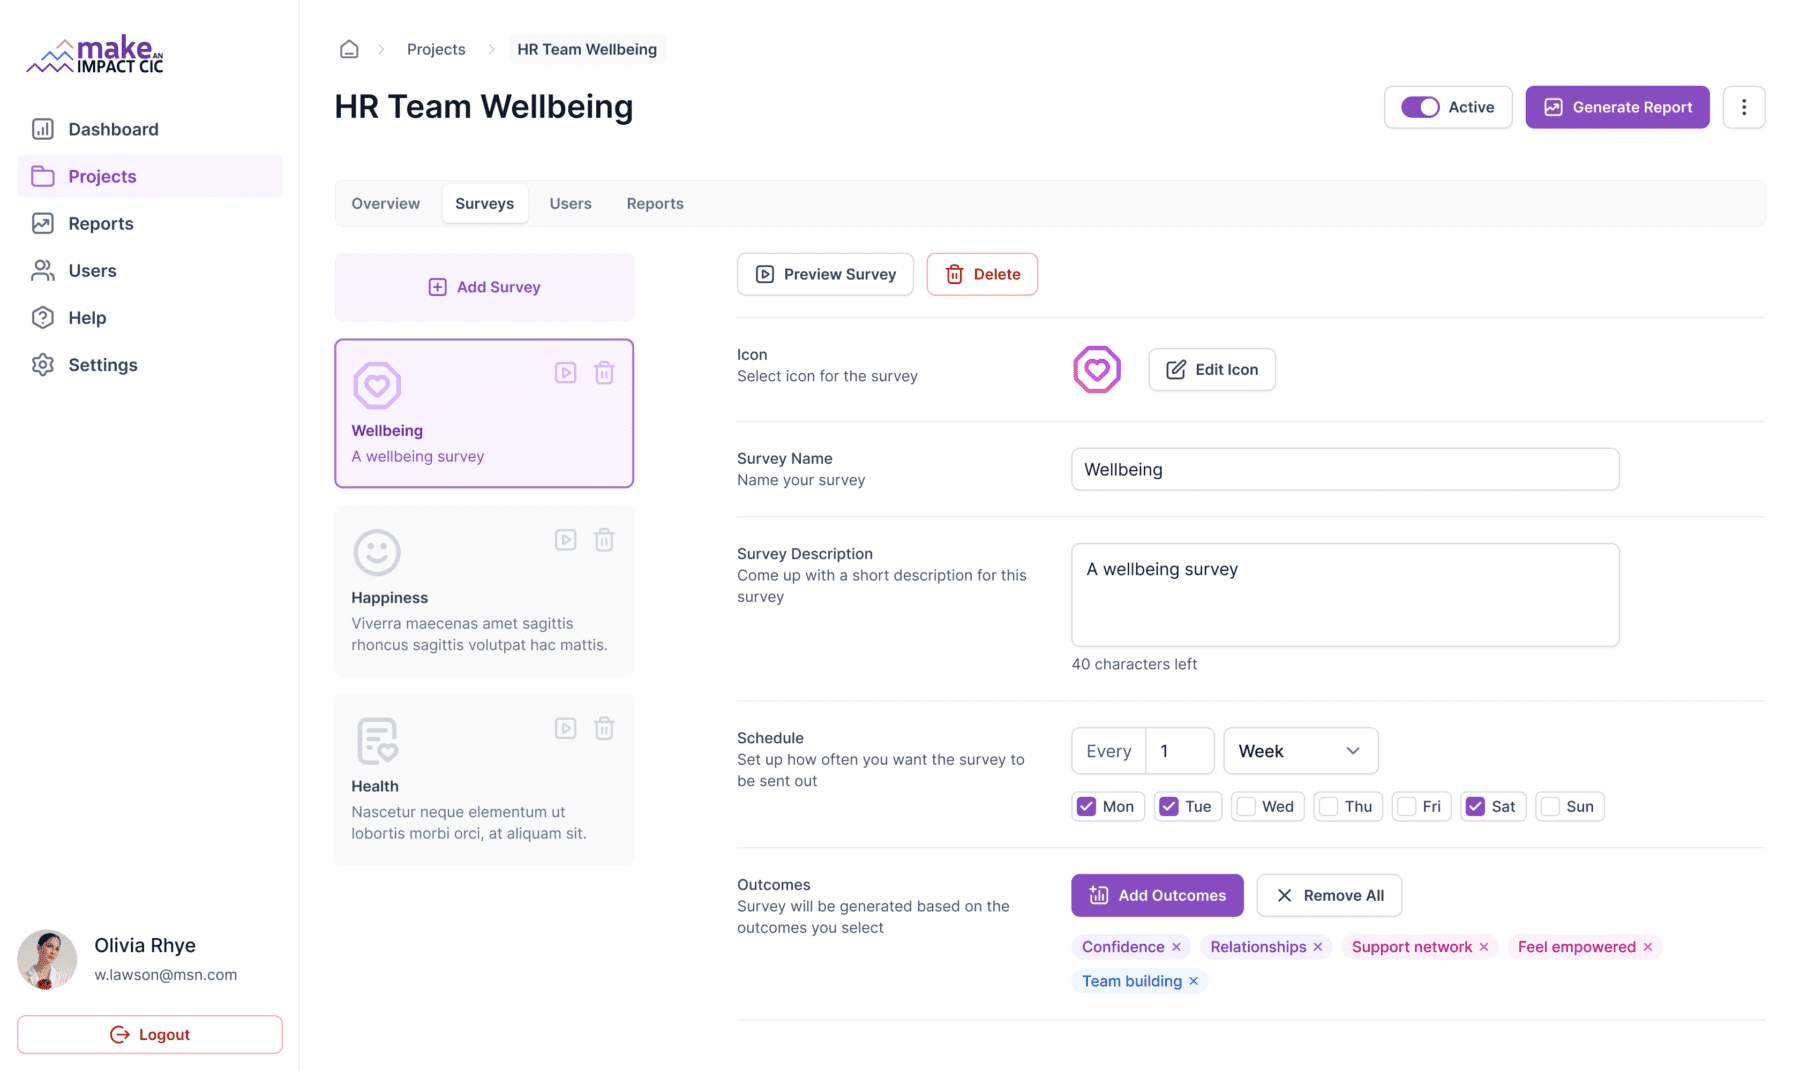
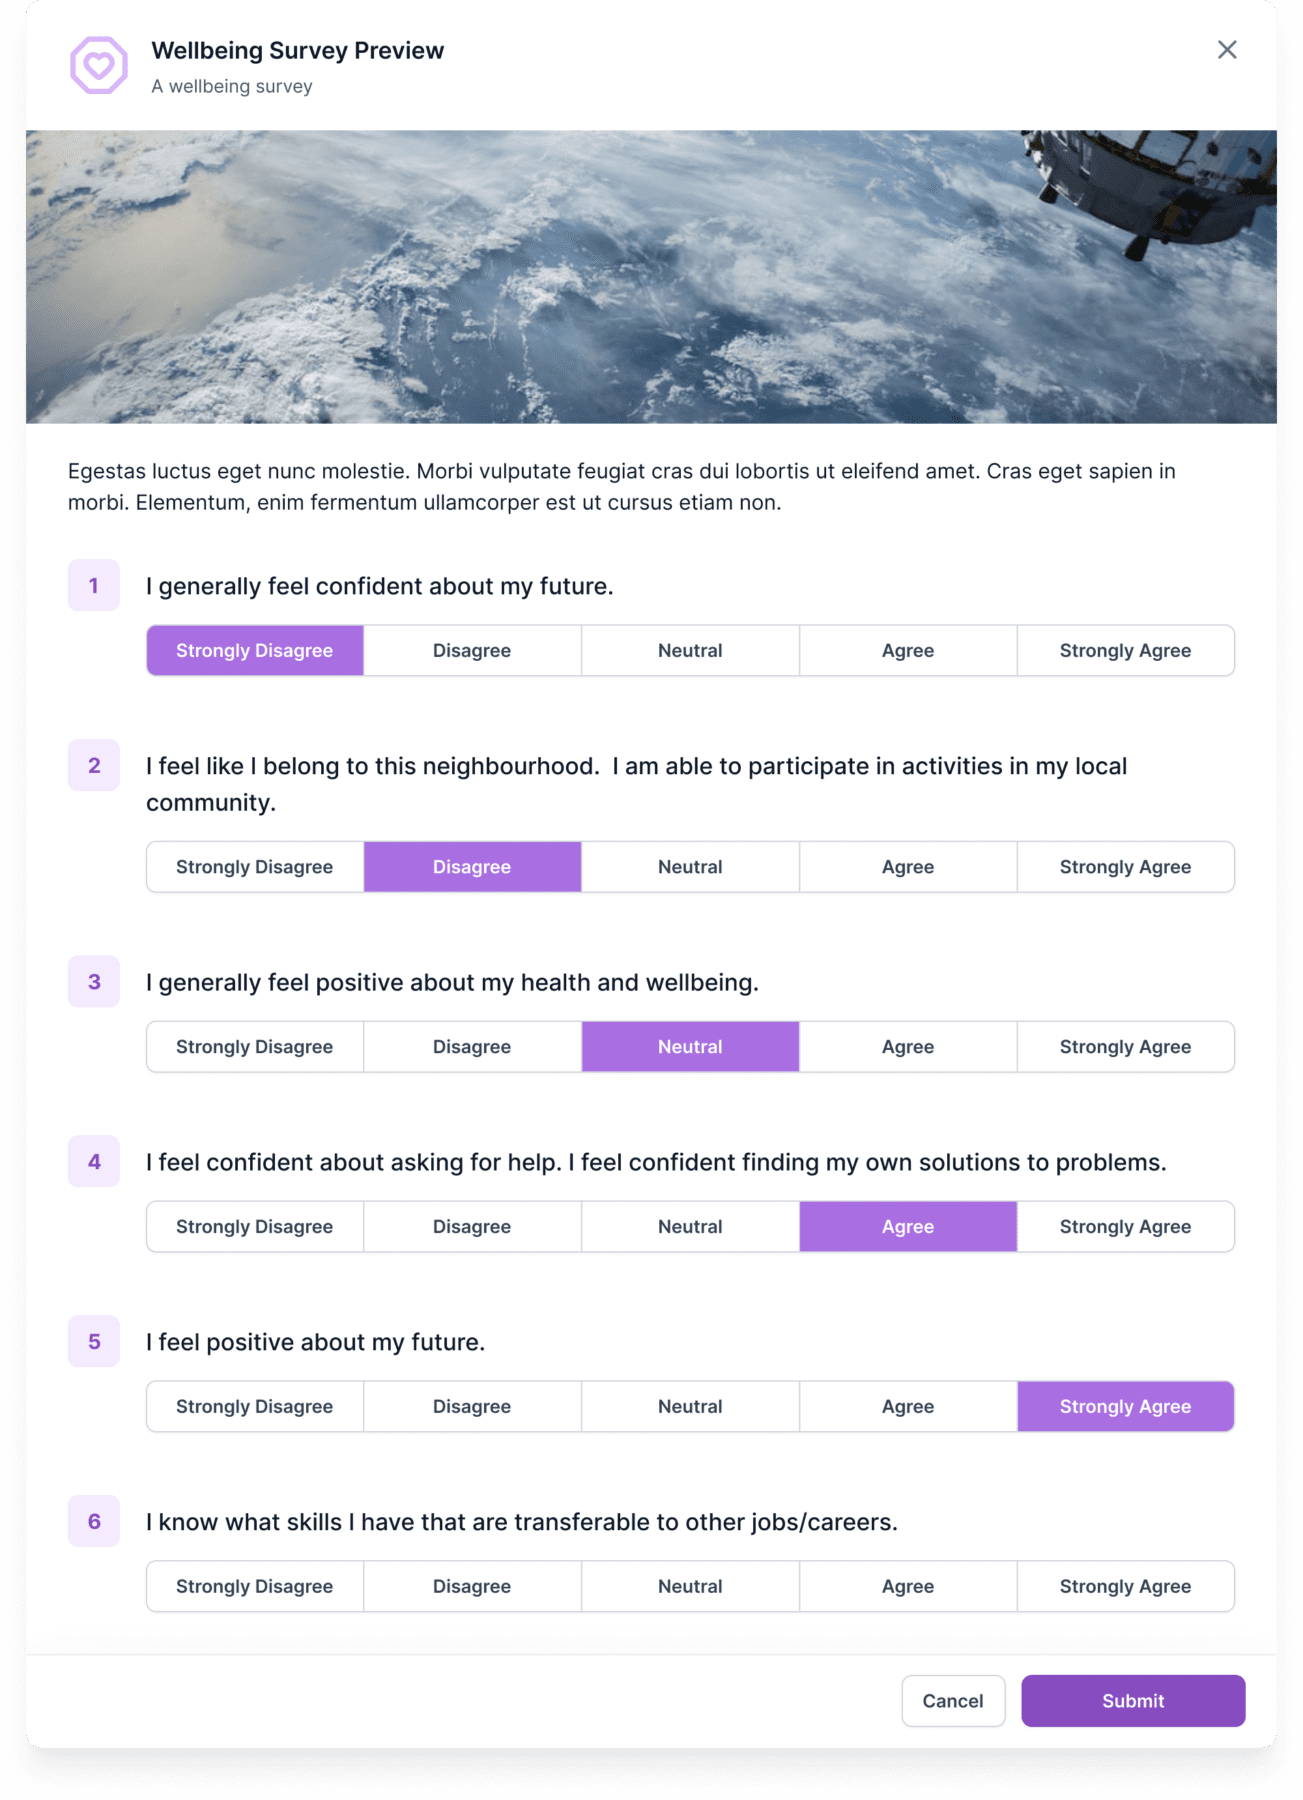
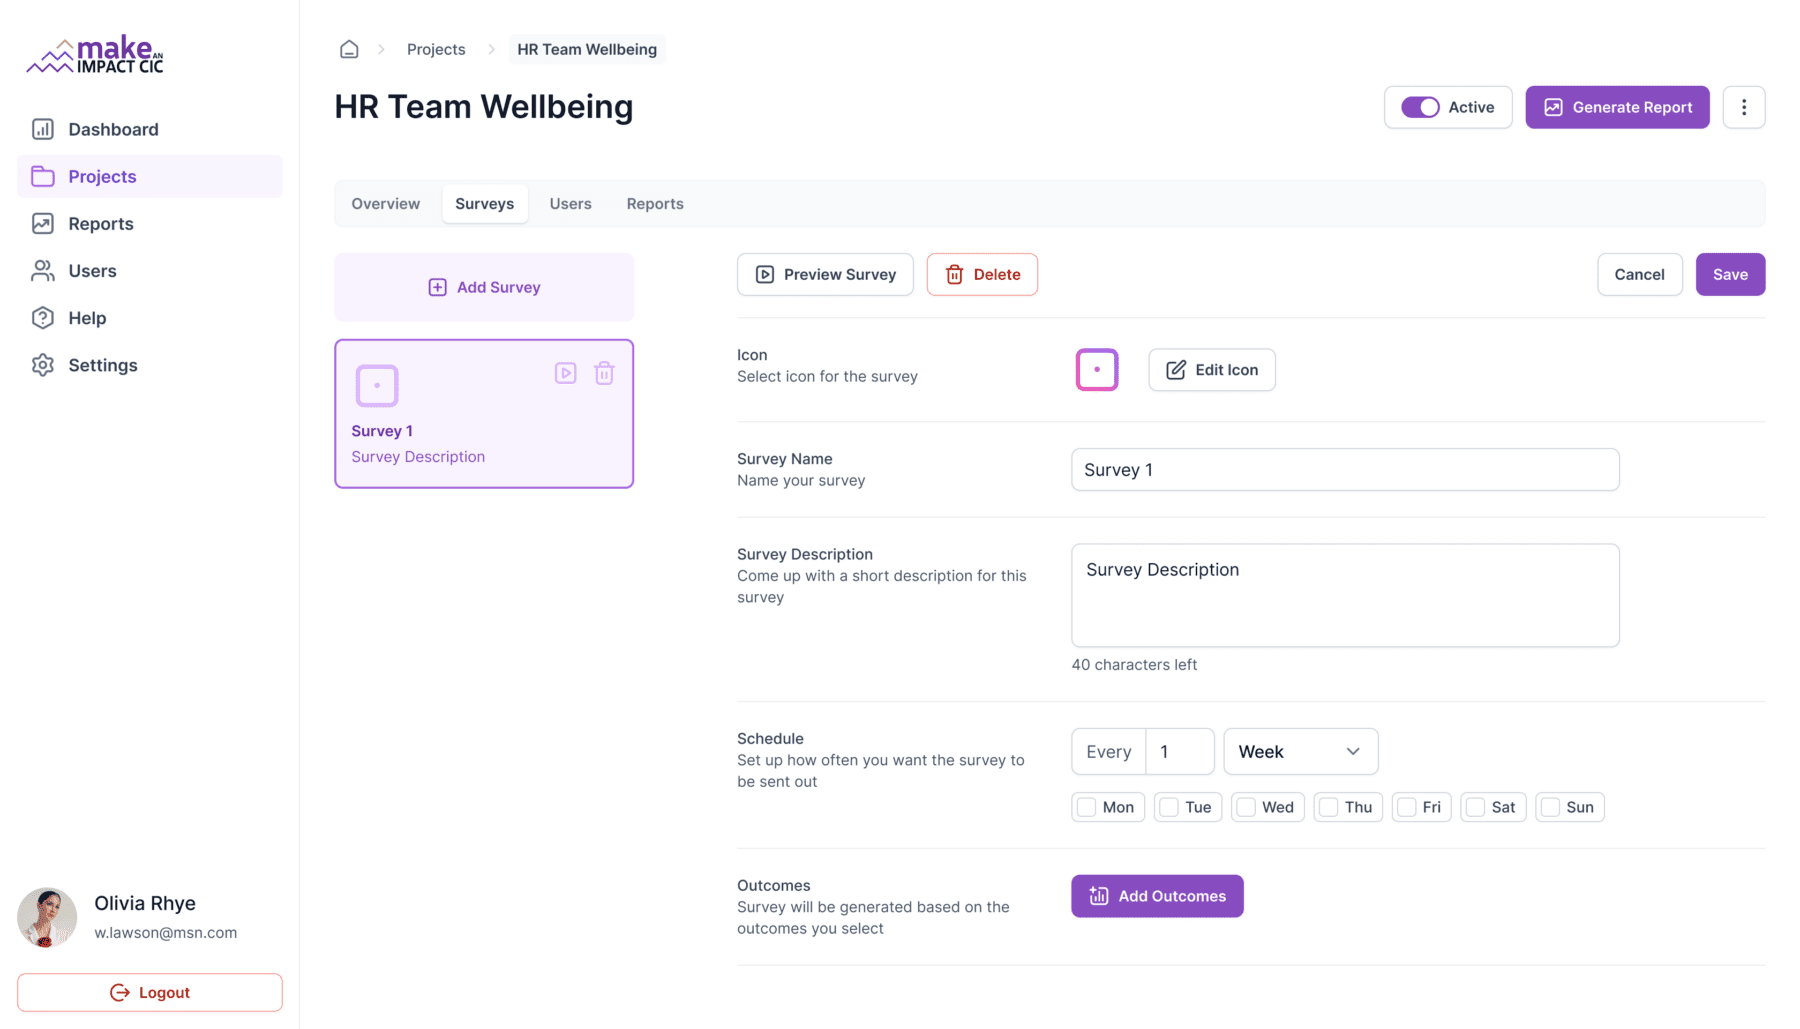
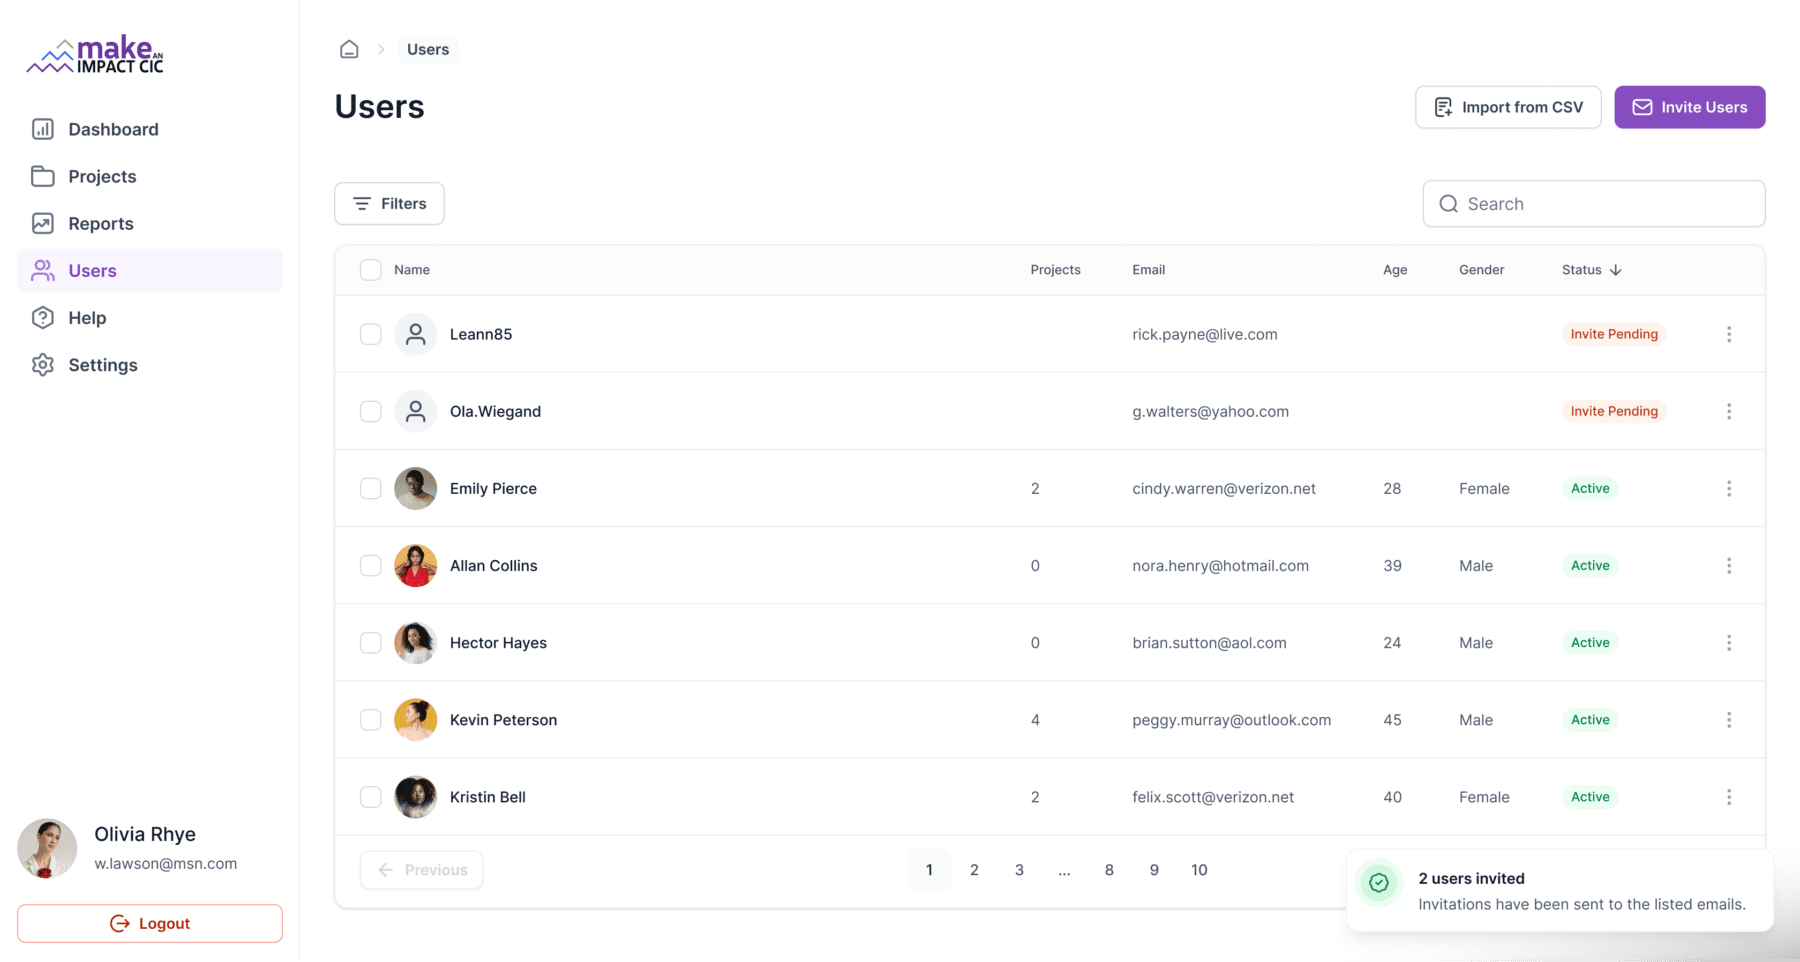
We designed a comprehensive UI for Make An Impact CIC, transforming their impact tracking into a fully automated system. This innovation streamlined their process of gathering and analysing training effectiveness within organisations.
Client
Year
2022
Client Benefits
- Efficiency: The automation of surveys saves time and reduces manual effort.
- Clarity: Structured data provides clear insights into the effectiveness of training programmes.
- Flexibility: Organisations can customise survey frequency to daily, weekly, or monthly intervals, allowing for continuous feedback.
- Actionable Insights: The analytics dashboard presents data in an easily digestible format, enabling swift decision-making.
Technology & Methods Implemented
- UX Design: Crafted an intuitive and user-friendly interface.
- Automation: Integrated automated survey distribution and data collection.
- Data Analytics: Developed an analytics dashboard for real-time data visualisation.
- User Management: Built a system for adding and managing users within different organisational areas.
- Survey Customisation: Enabled the creation of bespoke surveys tailored to specific training goals.
Make An Impact CIC, an organisation dedicated to improving training outcomes, faced challenges in efficiently tracking the impact of their training programmes. They needed a solution to automate the feedback collection process and to generate quantifiable data from survey responses.
Our Impact
We created an intuitive UI design that allows organisations to seamlessly set up and manage impact tracking. The system enables companies to create dedicated areas for measurement, add employees, define specific goals, and schedule automated surveys. These surveys are designed to gather structured feedback periodically, which helps in assessing the effectiveness of training initiatives.
By automating the survey distribution and data collection processes, Make An Impact CIC can now quickly identify whether their training programmes are producing the desired outcomes. This system eliminates the need for manual data entry and analysis, providing them with clear, quantifiable results.
Could we help you build a better dashboard?


